
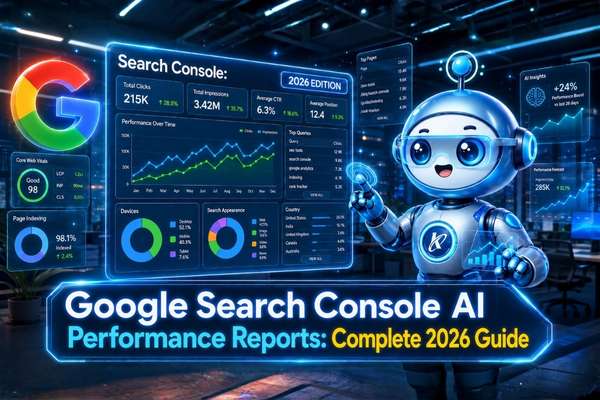
The New AI Performance Reports in Google Search Console
For years, Google Search Console (GSC) was the single best free tool for SEO. It showed your clicks, impressions, average position, and the queries that brought you traffic. But starting in 2025 and rolling out fully in 2026, Google has rebuilt the Performance section to handle a new kind of search: AI Overviews and AI Mode.
These new Google Search Console AI Performance reports show you exactly how your site is performing inside Google’s AI answers. You can see which queries trigger an AI Overview that cites your site, which pages are cited most often, and how your AI traffic is growing month over month. Without these reports, you are flying blind in the AI era of search.
In this complete 2026 guide, we will walk through every AI Performance report in GSC, what each one shows, how to read the numbers, and how to use them to grow your AI search traffic. We will also share a real-world dashboard setup, a Python script for the API, and a 30-day action plan you can start today.
What Are the AI Performance Reports in GSC?
Google added a dedicated section inside Search Console called AI Performance (sometimes labelled AI Search or AI Results depending on the language). It pulls together every signal related to your site’s appearance inside AI Overviews and AI Mode. There are six core reports inside it.
- Overview: A scorecard of clicks, impressions, CTR, and average position for AI Overview and AI Mode combined.
- AI Overviews: Detailed report for queries that triggered an AI Overview in standard search.
- AI Mode: Detailed report for queries that triggered Google’s chat-style AI Mode.
- Top Cited Queries: The list of search queries where AI cited your site as a source.
- Top Cited Pages: The list of your pages that AI cites most often.
- Trends: Month-over-month change in AI impressions, clicks, and CTR.
You can also reach the same data from the regular Performance → Search Results page by adding a Search Appearance filter and choosing AI Overview or AI Mode.
How AI Performance Reports Are Different from Regular Reports
| Aspect | Regular Performance Report | AI Performance Report |
| Counts | Every impression/click in blue links, news, images and video | Only impressions/clicks inside AI Overviews and AI Mode |
| Filter Tabs | Web, News, Image and Video | AI Overview and AI Mode |
| Search Appearance | Rich results, AMP and other search features | AI Overview and AI Mode |
| Dimensions | Query, Page, Country, Device, Date and Search Appearance | Same dimensions, plus AI Source Slot |
| Trend Behaviour | Stable for years | Fast growth and may shift from week to week |
| Best For | Classic SEO and blue-link traffic | AI SEO, citation share and brand authority |
Where to Find the AI Performance Reports in GSC
The exact menu label may change a little as Google rolls out updates, but the path is stable.
Step 1: Log in to search.google.com/search-console.
Step 2: Select the property you want to analyze (a URL prefix or a Domain property).
Step 3: In the left menu, click Search Results under the Performance section.
Step 4: Above the chart, you will see the new tabs: AI Overviews and AI Mode next to Web, News, Image, and Video.
Step 5: Click AI Overviews or AI Mode to see the focused report for that surface.
If you prefer the old Performance view, click the + button and add a Search Appearance filter for “AI Overview” or “AI Mode”. You will see the same data, with the ability to combine it with other filters.
Report 1: AI Performance Overview
The Overview report is your at-a-glance scoreboard. It shows four numbers for the date range you have set.
- Total Clicks: Total clicks to your site from inside AI Overviews and AI Mode combined.
- Total Impressions: Total times your page appeared in an AI answer.
- Average CTR: Clicks divided by impressions, shown as a percentage.
- Average Position: Your average ranking in the standard search result, even when shown inside an AI box.
Below the scorecards, you will see a time-series chart. Use it to spot trends, seasonal patterns, and the impact of any content update.
How to Read the Overview Report
- Set the date range to the last 90 days for stable numbers.
- Use the Compare button and compare to the previous 90 days. This shows your growth or decline.
- Note down the four numbers. Save them in a simple spreadsheet. This becomes your baseline.
- Repeat the comparison every month. Track the trend, not the daily number.
Report 2: AI Overviews Deep-Dive
The AI Overviews report goes deep into the queries that trigger Google’s standard AI box. It uses the same five dimensions as the regular Performance report: Query, Page, Country, Device, and Date.
Click the Pages tab to see which of your URLs are most often cited. Click Queries to see which keywords are turning into AI answers that point to your site. Click Countries to see where your AI citations are growing — the United States, India, the United Kingdom, and Brazil are usually the leaders in 2026.
What to Look For in the AI Overviews Report
- Pages cited 100+ times in 90 days: These are your AI authority pages. Protect and expand them.
- Queries with 50+ impressions but less than 10 clicks: These are citation opportunities. Your page is being cited but not clicked. Improve the title and the Quick Answer block.
- Pages cited in 3+ countries: Global authority signal. Invest in translated content for these pages.
- Mobile vs Desktop CTR gap: If mobile CTR is much lower than desktop, your page is slow or hard to read on mobile.
Report 3: AI Mode Deep-Dive
The AI Mode report is the newest and the most volatile. It shows queries and pages that triggered Google’s chat-style experience. Many SEOs find that AI Mode has higher CTR but fewer impressions than AI Overviews, because users in AI Mode are doing more focused research.
Why AI Mode Metrics Look Different
- Impressions are lower: AI Mode is still being rolled out and is only triggered by certain query types.
- CTR is higher: Users in AI Mode are typically deeper in their research and are more likely to click source links.
- Pages cited are different: AI Mode often cites comparison pages, how-to guides, and detailed product pages, while AI Overviews lean toward definitions and short answers.
- Conversions are higher: Because AI Mode users are more focused, the small click volume often converts better.
Report 4: Top Cited Queries
The Top Cited Queries report is the most actionable AI report in GSC. It shows you the exact search queries that triggered an AI answer and where your page was cited as a source.
Use this report to build your next content calendar. Each row is a topic where Google has decided your site is authoritative. Your job is to expand that authority with related content, FAQ schema, and stronger internal links.
Example: Reading the Top Cited Queries Report
Query: “how to calibrate a flow meter” |
Report 5: Top Cited Pages
The Top Cited Pages report shows which of your URLs Google is citing most often in AI answers. This is the report that tells you where your topical authority lives.
How to Use the Top Cited Pages Report
- Sort the table by Impressions descending.
- Pick your top 20 pages.
- For each one, open the page and check: Is the Quick Answer block clear? Is the schema valid? Are the internal links strong? Is the content fresh?
- Update each page with at least one improvement.
- Add 3 to 5 new internal links from other pages on your site to each of the top 20 pages.
Report 6: AI Trends and Comparisons
The Trends report shows how your AI Performance numbers are changing over time. You can compare any two date ranges. Most SEOs compare the last 28 days to the previous 28 days. This gives a fresh but stable view.
Key Trend Metrics to Watch
- AI Impressions Growth: Are more of your pages being cited month over month?
- AI Click Growth: Are users clicking your source links?
- AI CTR Trend: Is your CTR going up (good — your titles and answers are sharper) or down (bad — AI answers are getting more complete, so users read the box and leave)?
- Share of Voice vs Last Quarter: Compare to the previous quarter. Quarter-over-quarter numbers are the cleanest signal of long-term AI SEO health.
AI Performance Report Filters You Should Use Every Week
Filters are the key to turning the AI reports into actions. Here are the five filters we use in our own audits.
- Filter by Page: Pick one important page and review its AI performance weekly.
- Filter by Country: Find your strongest and weakest markets. Focus content investments where the data shows growth.
- Filter by Device: Compare mobile vs desktop. Most AI traffic is mobile. If your mobile numbers are weak, fix the page first.
- Filter by Search Appearance: Switch between AI Overview and AI Mode to see which one is driving the most value.
- Filter by Date: Compare last 28 days to the previous 28 days for a fast trend view.
Reading the Numbers: A Practical Example
Here is a worked example so you can see how all the pieces fit together. Imagine you run a B2B SaaS blog. In the last 28 days, your AI Performance report shows:
- Clicks: 1,840 (up 22% vs previous 28 days)
- Impressions: 26,400 (up 31%)
- CTR: 7.0% (down 0.5 percentage points)
- Average Position: 6.8 (down from 7.4 — improvement)
What does this tell you?
- Google is citing your pages more often. Impressions are up 31%, which is strong growth.
- Your average ranking is improving. You are climbing the SERP from 7.4 to 6.8.
- Total clicks are up 22%, but CTR is slightly down. This means Google is showing your page more often, but the AI box is now answering some queries without the user clicking. This is the zero-click shift.
- Action: add Quick Answer blocks at the top of every cited page, sharpen the title tags, and add FAQ schema to lift CTR back up.
Common Numbers You Will See in AI Performance
| Metric | Median | Top 10% of Sites | What Top Sites Do Differently |
| AI Overview CTR | 6% to 9% | 12% to 18% | Strong Quick Answer block and FAQ schema |
| AI Mode CTR | 9% to 14% | 18% to 25% | Detailed, original content that AI cannot easily reproduce |
| Share of Queries with AIO | 15% to 30% | 40% to 60% | Topical authority from hundreds of related articles |
| Top Cited Page Share | 30% to 50% | 10% to 20% | Distributed citations across many pages with less concentration |
| AI Citation Growth (MoM) | +5% to +10% | +15% to +25% | Weekly content updates and schema improvements |
How to Pull AI Performance Data with the API
For daily or weekly automation, use the Search Console API. The same searchAppearance filter works in the API. Here is a working Python example that pulls last 28 days of AI Overview and AI Mode data and saves it to a CSV.
import csv
from googleapiclient.discovery import build
from google.oauth2 import service_account
SCOPES = [‘https://www.googleapis.com/auth/webmasters.readonly’]
creds = service_account.Credentials.from_service_account_file(
‘gsc-credentials.json’, scopes=SCOPES)
service = build(‘searchconsole’, ‘v1’, credentials=creds)
def pull_ai_data(ai_type, filename):
request = {
‘startDate’: ‘2026-06-12’,
‘endDate’: ‘2026-07-10’,
‘dimensions’: [‘date’, ‘query’, ‘page’],
‘dimensionFilterGroups’: [{
‘filters’: [{
‘dimension’: ‘searchAppearance’,
‘operator’: ‘equals’,
‘expression’: ai_type
}]
}],
‘rowLimit’: 25000
}
response = service.searchanalytics().query(
siteUrl=’https://arankainstruments.com/’,
body=request).execute()
with open(filename, ‘w’, newline=”) as f:
writer = csv.writer(f)
writer.writerow([‘date’, ‘query’, ‘page’, ‘clicks’,
‘impressions’, ‘ctr’, ‘position’])
for row in response.get(‘rows’, []):
keys = row[‘keys’]
writer.writerow([
keys[0], keys[1], keys[2],
row[‘clicks’], row[‘impressions’],
round(row[‘ctr’] * 100, 2), round(row[‘position’], 1)
])
pull_ai_data(‘AI_OVERVIEW’, ‘ai-overview-data.csv’)
pull_ai_data(‘AI_MODE’, ‘ai-mode-data.csv’)
Run this script once a week and you will have a full historical record of your AI Performance. Combine the two CSVs in a dashboard to track growth over time.
How to Build an AI Performance Dashboard in Looker Studio
Looker Studio (free) is the easiest way to make the AI Performance data visible to your team. Here is a 30-minute setup.
- Open lookerstudio.google.com and create a new blank report.
- Add a Search Console data source. Pick your property.
- Add a filter: Search Appearance equals AI Overview.
- Add four scorecards: Clicks, Impressions, CTR, Position. Set the date range to last 28 days.
- Add a time series chart. Dimension: Date. Metric: Impressions. This shows the AIO growth curve.
- Add a bar chart. Dimension: Page. Metric: Impressions. This shows the top cited pages.
- Add a table. Dimensions: Query, Page. Metrics: Clicks, Impressions. Sort by Impressions.
- Duplicate the page, change the filter to AI Mode, repeat steps 4 to 7.
- Schedule an email to your team every Monday at 8 am.
How to Improve Your AI Performance Numbers
Now that you have the data, here is how to act on it. These are the 8 levers that move AI Performance the most in 2026.
- Add a Quick Answer block: 2 to 3 sentences that directly answer the page’s main question. Put it right under the H1.
- Use schema markup: Article, FAQ, HowTo, and Product schema are the most cited. Use the Schema Markup Validator to confirm they are valid.
- Build topical clusters: Publish 5 to 10 related articles on the same topic. AI models reward depth.
- Add unique data: Original surveys, original research, original photos, original screenshots. AI models prefer to cite primary sources.
- Strengthen internal links: Each top cited page should have at least 5 internal links pointing to it from other relevant pages on your site.
- Update top pages monthly: Add a “Last updated” date. AI models and users both trust fresh content more.
- Earn third-party mentions: Guest posts, podcast appearances, press coverage. AI models use these as trust signals.
- Improve Core Web Vitals: Pages with good LCP, INP, and CLS rank better and are cited more often in AI Overviews.
Common Problems in AI Performance Reports (and Fixes)
Problem 1: “The AI report shows zero data for my site”
Symptom: You open the AI Performance report and it is empty. |
Fix: AI data is only shown for sites with at least 1,000 impressions and 50 clicks in the last 90 days. If you are below that threshold, focus on growing standard organic traffic first. Once you cross the threshold, AI data will appear within 7 days. |
Problem 2: “My AI Overview impressions are growing but clicks are flat”
Symptom: Impressions are up 40% but clicks are up only 5%. |
Fix: This is the zero-click shift. AI answers are getting longer and more complete. Improve your Quick Answer block, add FAQ schema, and add a strong call to action in the first 100 words. Use the Pages tab to find pages with the largest click gap and update them first. |
Problem 3: “I am cited as a source but my brand is not mentioned”
Symptom: Google cites your URL but does not mention your brand name in the AI answer. |
Fix: Add your brand name inside the Quick Answer block. Use phrases like “According to Aranka Instruments…” in the first 30 words. AI models often lift that exact phrase into the answer. |
Problem 4: “AI Mode report shows no data”
Symptom: The AI Mode tab is empty even though you have organic traffic. |
Fix: AI Mode is still being rolled out query by query and country by country. Most sites do not see AI Mode data until they have at least 5,000 monthly organic clicks. Wait 4 to 6 weeks and check again. |
Problem 5: “I am losing clicks but I cannot tell which queries”
Symptom: Total clicks are down 20%, but you do not know which queries are affected. |
Fix: Open the regular Performance report. Sort by Position. Look at queries where you rank 1 to 3. Compare last 90 days to the previous 90 days. The big drops are almost always on informational queries where AI Overviews now appear. |
Real-World Case Study: A B2B Software Site
A B2B SaaS site we audited in Q1 2026 had a 32% drop in organic clicks over 12 months. Standard SEO was blaming backlinks. The real culprit was AI Overviews eating informational clicks.
What we did:
- Pulled the AI Performance report for the last 90 days.
- Found 18 pages with 1,000+ AI impressions but very low CTR.
- Added a Quick Answer block to each of those 18 pages.
- Added FAQ schema to all 18 pages.
- Improved the title tags to mention the year (e.g., “2026 Guide”) and a benefit.
- Built 30 new internal links to these 18 pages from related articles.
Result 60 days later: AI Overview CTR went from 4.1% to 9.2%. Total organic clicks recovered by 18% even though standard blue-link rankings were unchanged. The brand is now cited as a top source in 6 of the 18 target topics.
Action Checklist: The First 30 Days
Here is your 30-day plan to put this guide into action.
☑ Open GSC and find the AI Performance report. Note your four scorecards for the last 90 days.
☑ Export the Top Cited Queries list. Save it as your baseline CSV.
☑ Export the Top Cited Pages list. Pick your top 20 cited pages.
☑ For each of the top 20 pages, add a 2 to 3 sentence Quick Answer block under the H1.
☑ Add FAQ schema (3 to 5 questions) to each of the top 20 pages. Validate with the Schema Markup Validator.
☑ Add 3 to 5 new internal links from related articles on your site to each of the top 20 pages.
☑ Set up the Looker Studio dashboard described above. Schedule a weekly email to your team.
☑ Set up the Python API script. Run it once a week and save the CSVs.
☑ After 30 days, compare your AI Performance scorecards to your baseline.
☑ Repeat every month. The AI era rewards consistency, not one-time fixes.
Conclusion: Make AI Performance Reports a Monthly Habit
The new Google Search Console AI Performance reports are the single most important free tool for AI-era SEO. They tell you which queries trigger an AI answer, which of your pages are cited, and how your AI traffic is growing over time. Use the overview, the deep-dive, the top cited queries, and the top cited pages every month. Build a Looker Studio dashboard. Pull weekly API exports. Update your top cited pages with Quick Answers, FAQ schema, and stronger internal links. Repeat.
The sites that win the AI era are not the ones with the most content. They are the ones that are most often cited. AI Performance Reports in GSC show you exactly how to get there.
Frequently Asked Questions (FAQs)
AI Performance reports are a new section in Google Search Console that show how your site appears in Google’s AI Overviews and AI Mode. They include clicks, impressions, CTR, top queries, top pages, and trends for AI-driven search.
In 2026, Google added a new left-menu item called ‘AI Performance’ or ‘AI Search’ under Search Results. You can also reach the same data via Performance → Search Results → filter by AI Overview or AI Mode.
AI Overview is the AI box at the top of a standard Google search result. AI Mode is a separate chat-style experience. GSC shows separate numbers for both, so you can see which one is driving traffic to your site.
The regular Performance report counts every impression and click in standard blue links. The AI Performance report counts only impressions and clicks that happened inside AI Overviews or AI Mode. Many sites see a 10% to 30% drop in standard clicks because users read the AIO box instead.
To improve your AI Performance numbers, write a clear Quick Answer at the top of every important page, add FAQ and Article schema, build topical authority with internal links, and earn mentions on trusted third-party sites.
Yes, all verified GSC properties get AI Performance data, but the data is only shown for sites that have had at least 1,000 impressions and 50 clicks in the last 90 days. Very small sites may see the report empty until traffic grows.
Yes. GSC has a Compare mode where you can put AI Overview and Web side by side. You can also export both as CSV and build a side-by-side dashboard in Looker Studio or Google Sheets.
Related Posts
Generative Engine Optimization (GEO): 2026 Playbook for Indian Businesses
Generative Engine Optimization (GEO): The 2026 Playbook for Indian Businesses For the last two decades,…
Agentic SEO: How to Prepare Your Website for AI Search Agents (2026 Guide)
What Is Agentic SEO? Agentic SEO is the practice of optimizing your website so AI…
How to Measure Your Brand’s Visibility in ChatGPT, Gemini and AI Search (2026 Guide)
What Is Brand Visibility in AI Search? Brand visibility in AI search is a simple…